RangeCollectionView
09 Apr 2011WPF and Silverlight both support an abstraction called collection views, manifested by the ICollectionView interface. Whenever you bind to a collection, you’re actually binding to a collection view, whether you do so explicitly or not. The original collection is exposed via the ICollectionView.SourceCollection property, but is often referred to as the “underlying collection”.
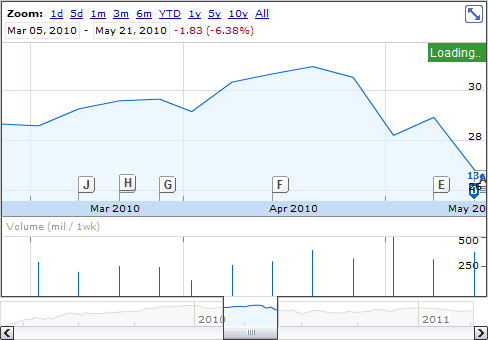
WPF/SL both ship with some commonly-used collection view implementations, but sometimes you need something a little different. In a previous post I showed a custom collection view that can be used to implement virtual paging in Silverlight. In this post I’m going to show you a collection view that exposes a range of items in its underlying collection. This is useful, for example, when you have a larger data set that the user is able to “zoom into”. An obvious example is the Google finance charts:

Notice how the chart requires the full set of data in order to render the lower preview area, as well as a subset of data in order to render the upper zoomed area. It is this subset that we want to be able to easily expose via a custom collection view.
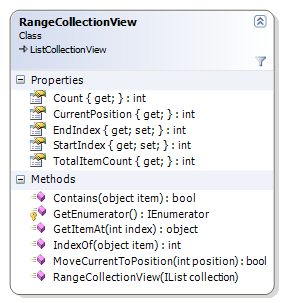
My design for this collection view is quite straightforward. Here is the public API:

As you can see, I called the custom collection RangeCollectionView. It extends the built-in ListCollectionView and adds two important properties: StartIndex and EndIndex. These indexes demarcate the subset of the underlying collection that will be exposed by the range collection view. They are both inclusive.
Suppose you have a list of month names in order (“January”…“December”). If you wrap that list in a range collection view and set StartIndex to 5 and EndIndex to 9, that range collection view will expose only the following items:
- June
- July
- August
- September
- October
Internally, RangeCollectionView uses the StartIndex and EndIndex properties to redefine the behaviour of various members defined by ListCollectionView. ListCollectionView is sufficiently flexible to allow this, which is a very good thing because it means we get certain features for “free”, like sorting and grouping.
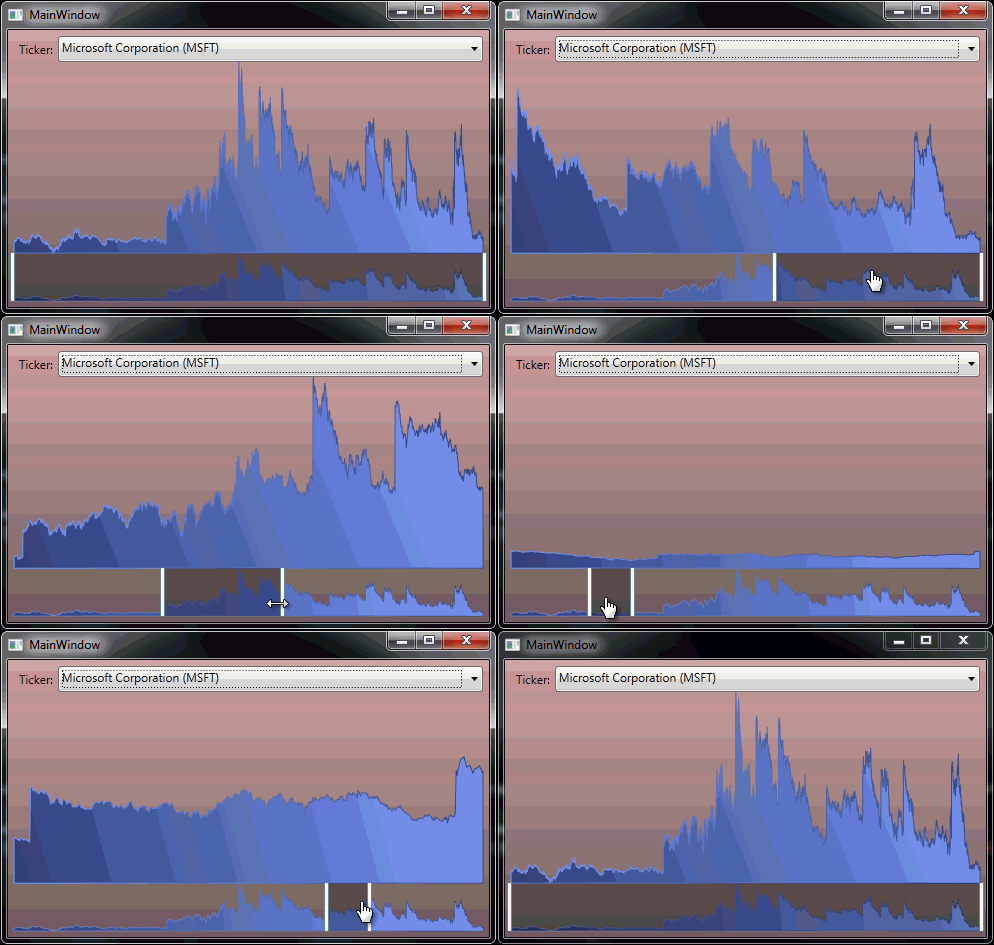
Going back to our chart example, consider that we can simply wrap our primary data set in a RangeCollectionView and then modify StartIndex and EndIndex according to the set of data the user has zoomed into. As the user zooms in, the start and end indexes move closer together. As the user zooms out, they widen.
The attached solution provides the code for RangeCollectionView, related unit tests, and a working example of how RangeCollectionView can be used to achieve an experience similar to that on Google finance. Here is an example of it in action:
